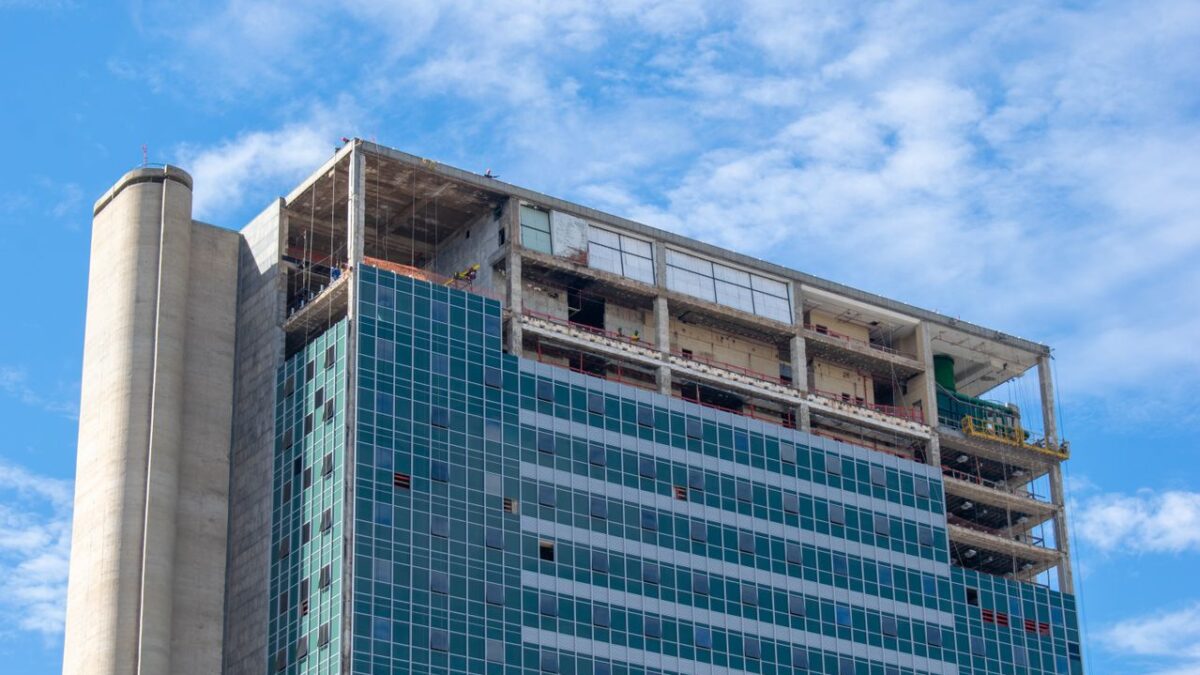
In the first three months of 2026 the authorities issued permits for administrative buildings with a useful floor area of 64 246 m², against 60 137 m² for the whole of 2025. Permitted office floor space in one quarter thus beat the four preceding ones together by 6,8 %. The number of permitted buildings meanwhile went from six to twelve, which is double — and it is precisely this mismatch between area and count that determines what the figure can be read for and what it cannot.
The numbers for the first quarter of 2026
The data comes from the building permits table in the DATAcube database of the Statistical Office of the Slovak Republic, last updated on 3. 6. 2026 and ending with the first quarter of 2026. Two indicators are tracked in it for each building type: the number of new buildings and their useful floor area in m² under issued permits.
| Indicator | 1Q 2025 | 1Q 2026 | Change |
|---|---|---|---|
| Administrative buildings — area, m² | 4 880 | 64 246 | 13,2 times |
| Administrative buildings — count | 6 | 12 | double |
| Average area per building, m² | 813 | 5 354 | 6,6 times |
| Other non-residential buildings — area, m² | 262 157 | 294 535 | +12,4 % |
| Other non-residential buildings — count | 354 | 409 | +15,5 % |
| Average area per building, m² | 741 | 720 | −2,8 % |
The paradox: area against the number of buildings
The administrative row and the row of other non-residential buildings behave in opposite ways. Among other non-residential buildings the count and the area grow at roughly the same rate, so the average building stays where it was — 741 m² last year, 720 m² now. Among administrative buildings the area grows six times faster than the count, and the average permitted building has grown from 813 m² to 5 354 m².
The difference between six and twelve buildings is so small that a single large permit moves it by tens of percent. Permitted office floor space in a sample of this size does not measure a recovery in demand for offices; it measures the decision of a few investors to file in one quarter. For comparison, in the first quarter of 2024 the average permitted administrative building was 1 175 m² across fourteen buildings.
A change of source in the middle of the comparison
The dataset itself carries a note that a year-on-year comparison cannot get around. Up to the second quarter of 2025 the data was collected through the Stav 3-04 return; from the third quarter of 2025 it comes from the Statistical Register of Buildings, Houses and Dwellings. The figures for the third and fourth quarters of 2025 and for the first quarter of 2026 are marked as preliminary and will be refined.
Comparing 1Q 2026 with 1Q 2025 therefore places a value from the new register beside a value from the old return. Two collections are not interchangeable merely because they stand in one column: they differ in the scope of the survey and in the moment at which a permit enters the records. Until the office refines the first quarters from the new source, every year-on-year rise in this series carries the change of methodology as well as the market, and it cannot be said how much of the 13,2 times belongs to which of those two causes.
Construction output says something else
A second series from the same office measures work done rather than intent. According to monthly construction output, new construction, reconstruction and modernisation of non-residential buildings reached 454,2 mil. eur in the first quarter of 2026 against 360,1 mil. eur a year earlier, which is 26,1 % more. For the first half of 2026 it is 968,6 mil. eur against 802,4 mil. eur, or 20,7 % more.
This series is in current prices, so it also contains the movement of construction work prices and is not a measure of volume in m². The share of non-residential buildings in all construction output changed little: 26,3 % in the first half of 2025 and 27,1 % in the first half of 2026. The growth in construction is therefore broad, not office-led.
What the office floor space figure means for each role
Tenant. A permit is not supply. Years stand between the issue of a permit and the handover of space, so the 64 246 m² from 1Q 2026 changes no negotiating position this year or next. It is usable as a signal of where a large volume is being prepared, not of when it will be available.
Landlord. The risk is concentration: twelve buildings averaging 5 354 m² mean that future supply depends on a handful of projects and on whether their developers see them through. What has to be watched is the individual schemes, not the quarterly total.
Investor. The permits series has no regional breakdown, so nothing follows from it about the region in which the space will appear. The regional distribution of the office market is a separate topic, covered by another text on this site.
Sources and verification
| Indicator | Source | Note |
|---|---|---|
| Useful floor area and count of new buildings from permits | SU SR, DATAcube, table st2024qs | Updated 3. 6. 2026, series ends with 1Q 2026 |
| Change of collection from 3Q 2025 | Note in the same table | Stav 3-04 return up to 2Q 2025, then SRBDB |
| Construction output — non-residential buildings | SU SR, DATAcube, table st1006ms | Updated 11. 8. 2026, current prices |
| Average area per building | Own calculation | Area divided by count of buildings in the same quarter |
Difference of definitions. Permitted useful floor area and construction output are not two views of one figure. The first is the area of buildings with a permit issued in a given quarter, measured in m², regardless of whether building starts. The second is the value of work carried out in a given month, measured in euro of the current year. Adding them together is not possible.
Conclusions
The first quarter of 2026 brought, in the building permits series, 64 246 m² of permitted administrative area against 4 880 m² a year earlier and against 60 137 m² for the whole of 2025, across twelve buildings against six and forty-five. Other non-residential buildings added 294 535 m² across 409 buildings, which is growth of 12,4 % on a rise in count of 15,5 % and on a practically unchanged average size. Construction output on non-residential buildings grew, according to the monthly series, by 26,1 % in the first quarter and by 20,7 % in the first half, in current prices. Three things have to be watched: whether the office leaves the administrative row at this level once the preliminary quarters are refined, whether the twelve permitted buildings appear in developers‘ announcements as concrete schemes, and whether the second quarter of 2026 confirms the size of the average permitted building or returns to the thousand metres that has been usual in the series.
Materiál má informatívny charakter a nepredstavuje právne, daňové ani finančné poradenstvo.